

Outlier is a data tool designed for various types of sports betting research. In this review we will focus on their player prop data and how to effectively use the tools they offer.
Outlier is $20/month for the basic plan that will cover everything we go over in this one. Start a FREE 7-Day Trial here.
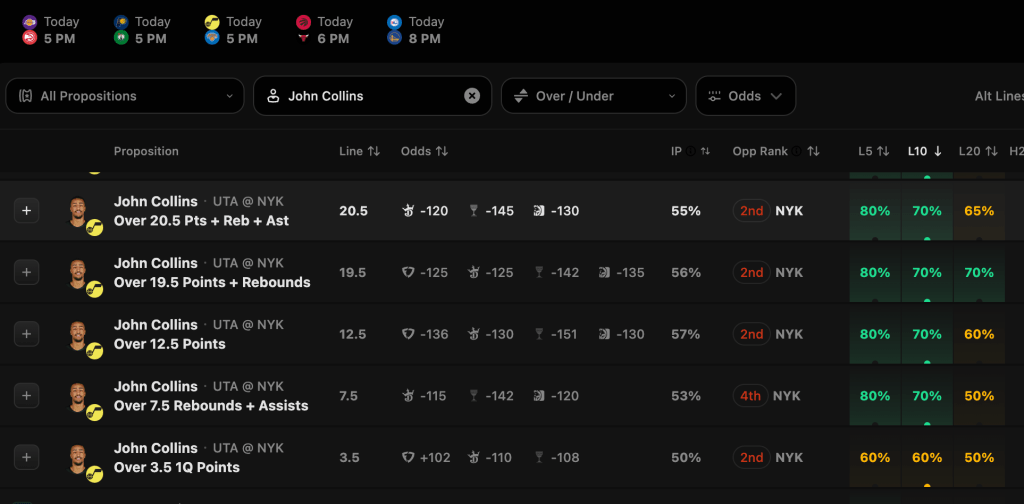
Once inside Outlier, navigate to the props section. From there you will find data from all the props available on player picks sites like PrizePicks and Underdog. On this page you can find the top picks and data like lines from a few sportsbooks. Click on one or search for the player you are looking for to dig into the data.
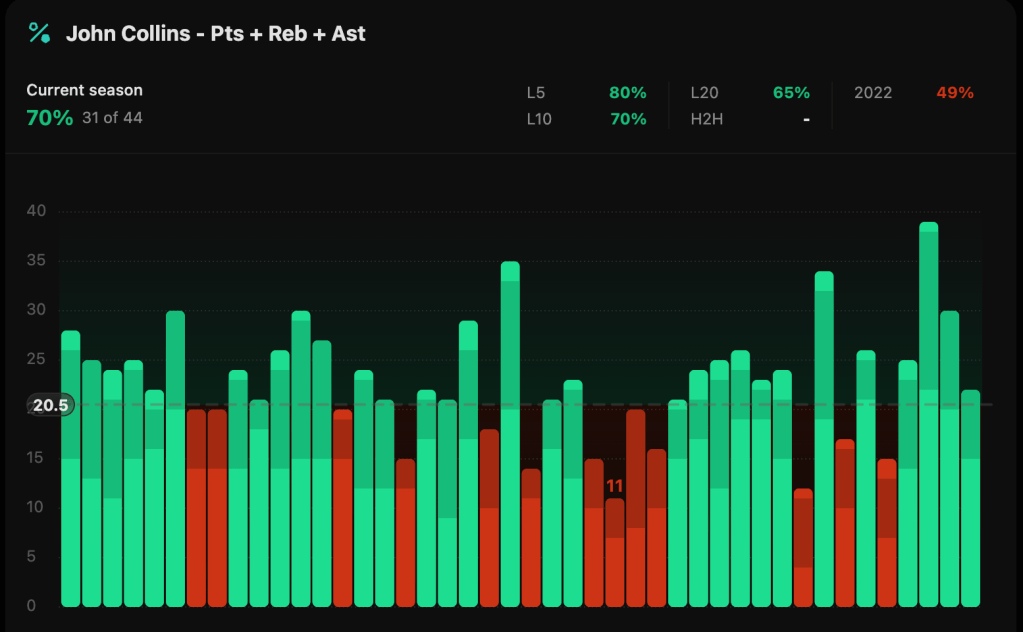
The first thing you will notice on this page is the bar graph that shows how many times that player has hit this line. In the image above you will see that John Collins has hit this line in 70% of his games, a pretty good indication this could be a good prop to take.

To get further info you can apply filters. The first one to try may be projecting how many minutes Collins may play. In blowout games it is common that Collins plays low 20 minutes. In close games he commonly plays 30+ minutes. For this game I projected Collins to play at least 27 minutes. You can see above that Collins has played 27 or more minutes in 24 games this year and has hit this line in 88% of those games.

Additionally, you can look at games where Collins has played 27+ minutes and games where Walker Kessler is out by using the “Games Without Player” tab at the top right of the above image. In these games he has hit this 6/6 times.
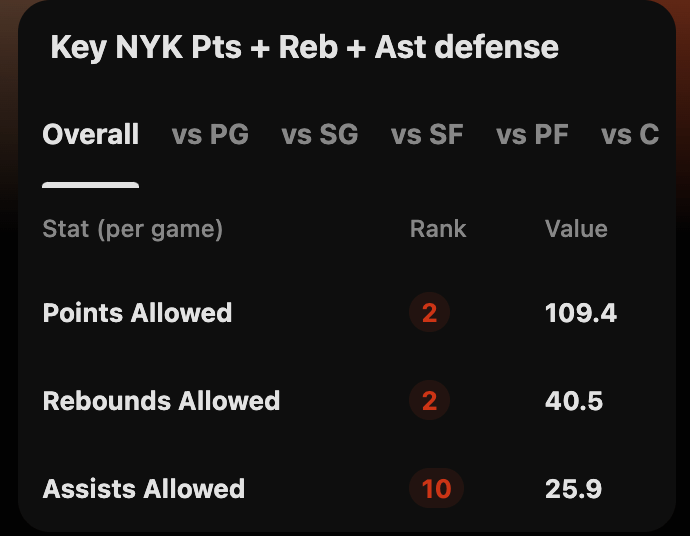
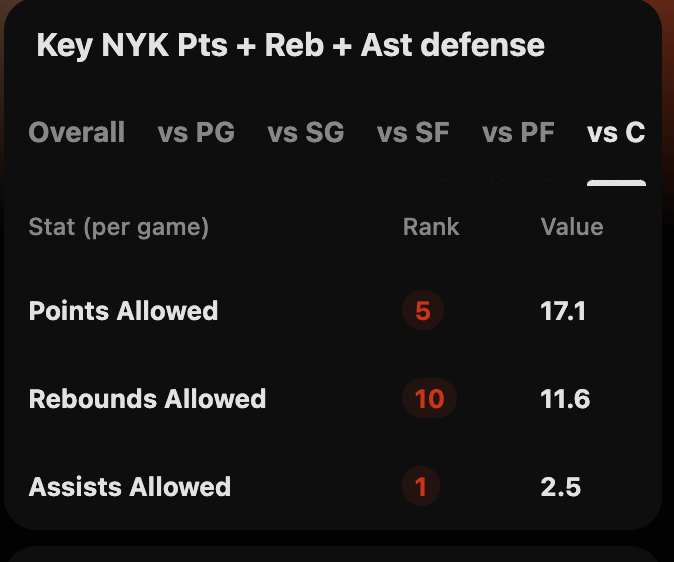
On the same page you can see how the player’s opponent ranks in the stat categories for the prop (above). This is the overall tab but it can be filtered by their position, such as C for Collins (below).
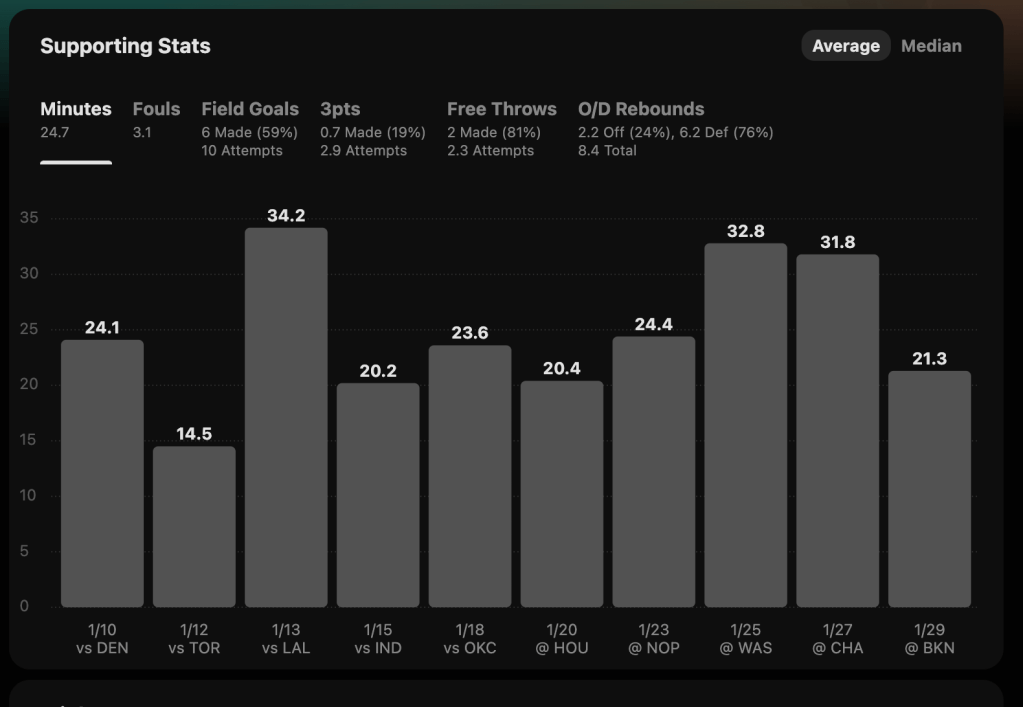
On the same page there is additional info. Below you can see minutes played per game but there are other various tabs to change what data the graph shows such as fouls, field goals, etc.
If you made it this far, try a 7-Day FREE Trial here!


Leave a comment